The “Better” Trap: Why Comparison Marketing Leads To Fighting For Only 24% Of The Market
When companies compete on features, price, and “brand,” they drive down margins collectively, which limits growth—and the value of the category plummets.
Dear Friend, Subscriber, and fellow Category Pirate,
Let’s do a little exercise.
We want you to think about anything you want except pink unicorns. No pink unicorns, that’s the only rule. You can think about anything, anything in the whole wide world, just not pink unicorns. You can think about lions. Zebras. Giraffes. The entire Amazon forest, if you’d like. Just absolutely, under no circumstances, can you think about pink unicorns.
Now, Pirate....
What are you thinking about?
PINK UNICORNS!
The Pepsi (Pink Unicorn) Challenge
In 1975, Pepsi ran what many marketers (mistakenly) believe to be one of the most “creative” campaigns in history.
The challenge consisted of a single blind taste test.
Pepsi representatives would stop unknowing customers at malls, shopping centers, and other public places and ask them to take a sip of two identical looking cups of cola: one containing Coke, the other Pepsi. The results were then compiled into TV advertising campaigns aimed to convince the general public that more Americans preferred the taste of Pepsi to Coke.
Now, let’s do the same exercise again.
We want you to think about anything you want except Coca-Cola. No Coca-Cola, that’s the only rule. You can think about anything, anything in the whole wide world, just not Coca-Cola.
Now, Pirate…
What are you thinking about?
COCA-COLA!
Legendary writer, Malcolm Gladwell, debunked the “success” of the Pepsi challenge 30 years later in his book, Blink. According to Gladwell, the same people who say in a blind taste test they prefer Pepsi because of its sweetness don’t end up finishing a whole can because they find it too sweet. But nevermind that.
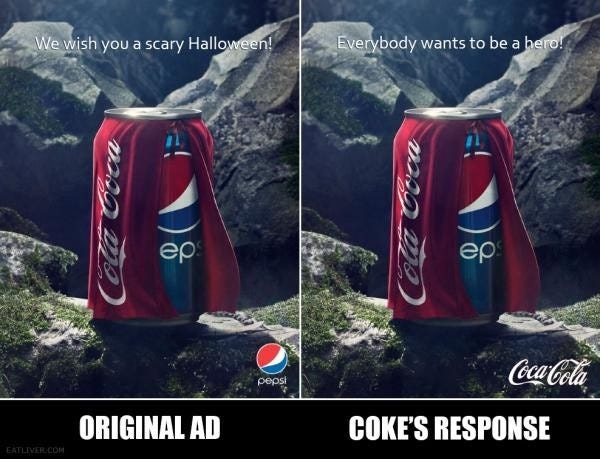
For more than 100 years, Pepsi’s entire marketing strategy has been in comparison to the category king of soda: Coca-Cola. There is almost no finer example than the very first line of dialogue in Pepsi’s Super Bowl LIII commercial in 2020, broadcasted to nearly 4 million people (and viewed who-knows-how-many-millions-of-times online thereafter).
“I’ll take a Coke.”
Pepsi might as well Venmo its entire marketing budget to The Coca-Cola Company.
Why?
Because according to our research, category kings capture the lion’s share of the upside of the category. More importantly, for every $1.00 of revenue growth, category creators generate $4.82 of market cap growth (compared to $1.77 generated for other fast-growing companies).
Over the past 10 to 20 years, has Pepsi’s “better product” marketing strategy been working?
No.
If anything, it has further reinforced the fact that Coca-Cola is the king of the soda category. Pepsi’s market share has been falling for more than a decade—which means, despite the company spending tens of millions of dollars on Super Bowl ads (or enlisting social media stars like Kendall Jenner to represent the brand), these efforts haven’t had any meaningful impact on dethroning Coca-Cola’s leadership position.
According to Nielsen (one of the global leaders in marketing mix modeling), the average dollar spent on advertising brings in only $0.70 of gross profit. This insight was derived from 40,000+ marketing mix models across hundreds of categories, all over the world. The takeaway here is that most companies would be more profitable (or, in Pepsi’s case, just as good of a “sweeter” category alternative) if they spent nothing on marketing at all.
For example, Pepsi’s market share in 1984 was 18.8%.
In 2009, Pepsi’s market share was down to 10%.
Then, in 2018, it was 8.4%.
In 2018, Pepsico spent $118 million dollars on advertising Pepsi, down from $139 million in 2013. Let’s make the conservative assumption that Pepsi spent at least $100 million dollars per year on advertising the Pepsi brand since 1984. That adds up to $3.6 billion dollars. Factoring in inflation and nominal returns from investing in treasuries, let’s call this $5 billion dollars. So per Nielsen, if Pepsi was “average” in its marketing ROI, they returned $3.5 billion back in gross profits on their $5 billion in advertising.
We’d bet the ROI was even lower given (a) all this money was spent on comparison marketing, (b) soda as a category has been in decline for more than a decade and (c) new beverage categories have risen dramatically in coffee (Starbucks, Keurig, Nespresso), energy drinks (Red Bull, Monster, 5-Hour Energy) and so forth.
Comparison marketing isn’t just bad marketing. It’s bad business strategy.
Strategy is often defined as how you allocate scarce resources to achieve the highest return on investment. So the question is: what else could Pepsi have done with $5 billion dollars to get a higher return?
To find our answer, let’s play the “What if I was a Category Pirate?” game.
What if, instead of paying Cardi B to yell OKURRRRRR, Pepsi used all that wasted advertising money and bought a company that yielded a breakthrough business model and a breakthrough data flywheel?
Pepsi could have bought:
Arrrrrrrrr! Category Pirates is a paid newsletter. Subscribe below to hop aboard! Every week, we send you new treasure maps, straight to your inbox.


